
Winter Olympic Games: Infographic using Adobe Illustrator
|
Project Information:
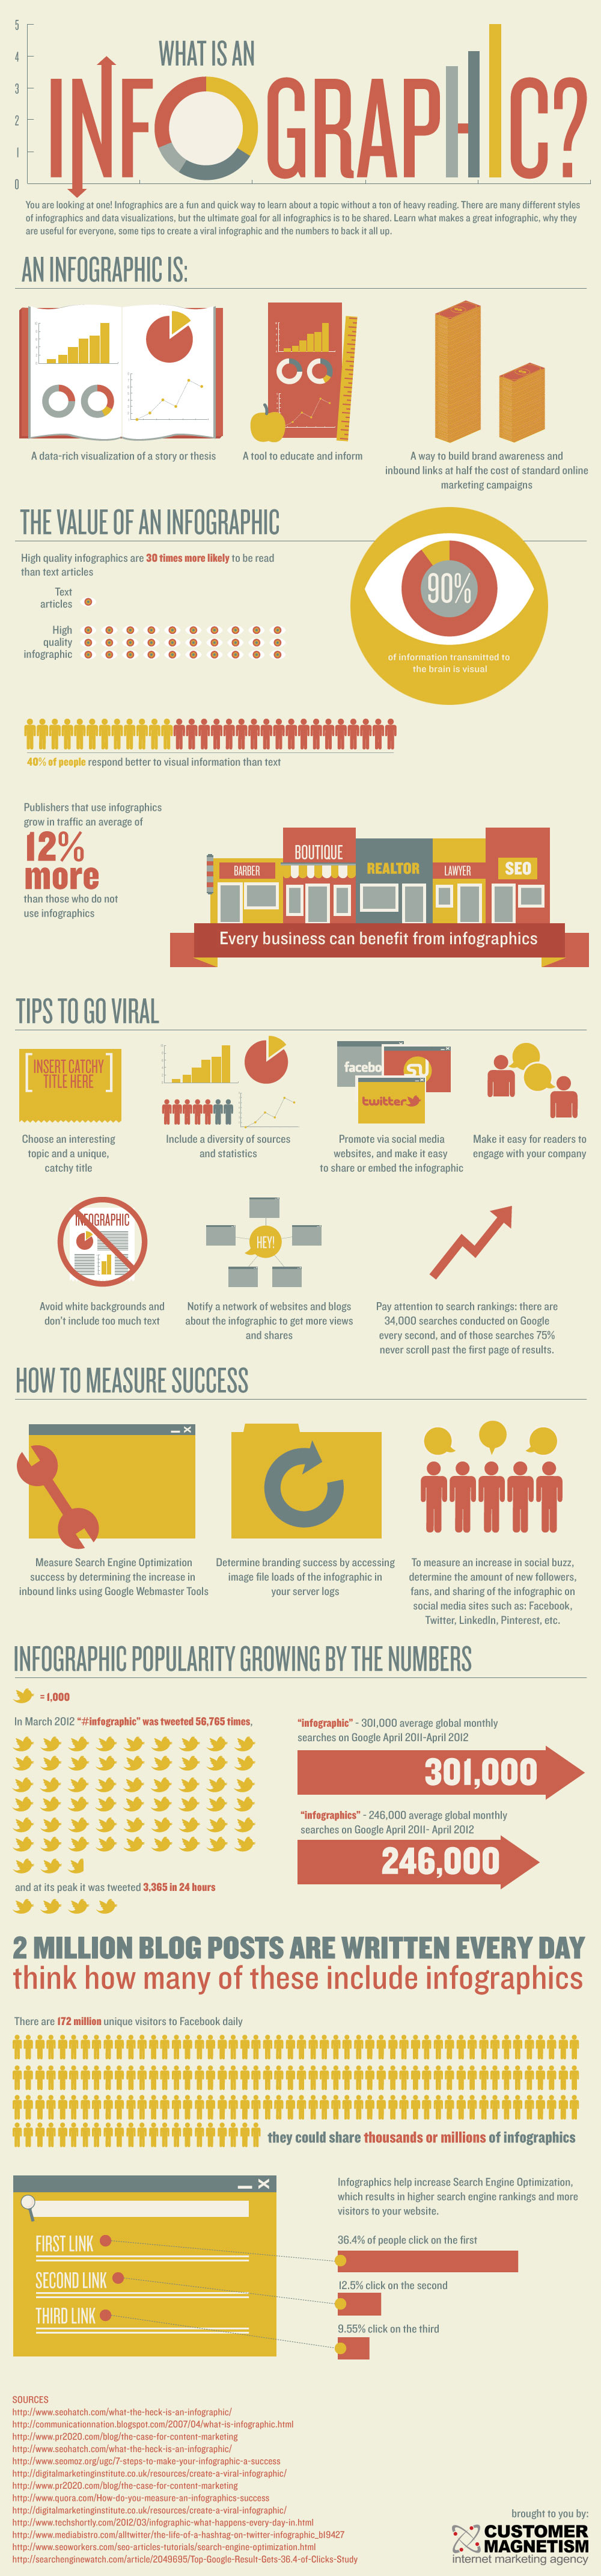
Using your Olympic Packet, pick at least 15 facts to display visually in your Winter Olympics Infographic. in·fo·graph·ic, infōˈgrafik noun 1.a visual image such as a chart or diagram used to represent information or data. "a good infographic is worth a thousand words"
| |||
Click on the image below to access the SOCHI PICTOGRAMS:

You can utilize the library of SYMBOLS in Microsoft Word to add to your Infographic:
I recommend: Webdings and Wingdings!

Some neat Illustrator Effects to add to your Infographic:
*Use sparingly*
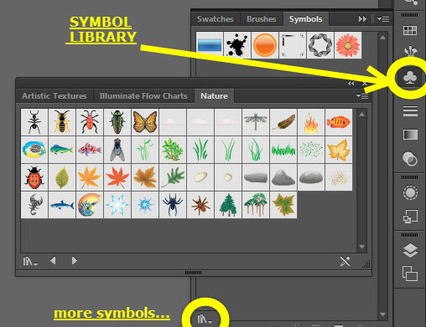
Symbol LibraryOn the RIGHT hand toolbar click on the icon that looks like a three leaf clover. This is the symbol library.
You can click on the icon in the bottom left that looks like a stack of books to access different symbol collections by topic. |
|
Graphic StylesOn the RIGHT hand toolbar click on the Graphic Styles tab. When it opens you can access the Graphic Styles LIBRARY.
Think of layering behind and element as a border or filling a box as a background. |

|

|
 Created by Customer Magnetism, an award winning Digital Marketing Agency.

![50 Crazy Facts About The Winter Olympics [Infographic]](http://thumbnails.visually.netdna-cdn.com/50-crazy-facts-about-the-winter-olympics-infographic_51e7cae28810d_w587.jpg)

